- Server Components
- Feed / Platfom
- Collector
- Filter
- Interface Bridge
- Real Time Data Apps
- Real-Time + Historical Data Apps
- Repo API
- Repo Server
- Repository
- Database
- Data Distributor
- Blender
- Historical Data Apps
Server Components
This Server can be configured to include the RIDE System, which is a sophisticated and adaptable data-retrieval system developed by Olsen.
Sun/Solaris, Intel/Solaris, and Intel/Linux platforms are supported, depending on availability of the live market data interface for these platforms.
The Server is deployed at customer site with a maintenance contract which assumes that remote access will be possible.
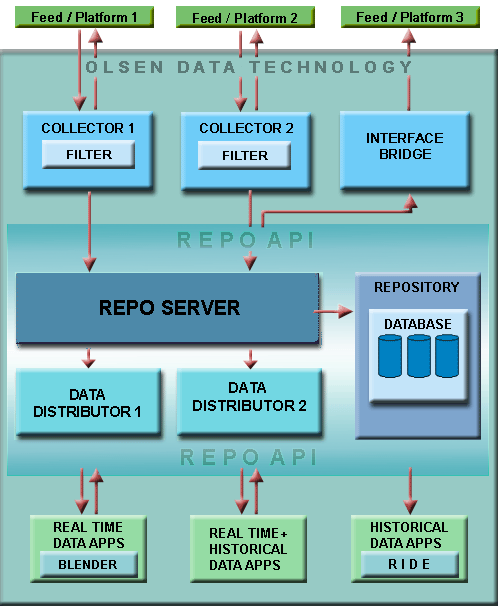
The schematic of a generic Olsen Data Server installation is presented below. (Typical installations may not take advantage of multi-platform support.)Maintenance schedule and deployment architecture can range from low to high criticality, including the possibility of no single point of failure.
Feed / Platfom
This is the server's connections with live market data. It is not provided by Olsen but is assumed to be present in one form or another at the customer's site. Feed = the data source with its unique data organization and formatting paradigms. Platform = the networking paradigm under which the data is delivered. Each collector interfaces with a specific Feed/Platform pair Supported (and proposed to be supported) Feed/Platform pairs:- Reuters Select Feed/Reuters Triach
- Reuters Select Feed/Bridge TRS
- Tenfore (satellite or Internet)/QuoteSpeed and Tapi2TCP (from Tenfore)
- Bloomberg/Data Licence (not for real-time applications)
- Bloomberg/Logiscope (proposed)
- Reuters Select Feed/TIBCO Rendezvous (proposed)
Collector
Each collector interfaces with a specific Feed/Platform pair it is built to handle. (Typical installations of our server interface with only one Feed/Platform, but the technology is designed to support multiple collectors.) Each collector accesses live data from its corresponding Feed/Platform, filters the data (a critical step in this process), and re-transmits the data to the Repo Server in a standardized format for writing to the Repository. If so configured—and admissible by the Feed/Platform—the collector also republishes data that passes the filter test to the Feed/Platform.To convert data to the standardized format, the collector must organize it using Feed-specific logic for determining the kind of instrument, the nature of the update, the critical fields that must be parsed, and the internal dependencies between fields which must pass logic tests to make sure the data is valid for writing to the Repository.
This logic becomes increasingly complicated when dealing with expiring instruments and futures. For example: when converting bond future data to the internal standard format, the collector may need to access cached information for other symbols to determine the cheapest-to-deliver underlier. The collector attempts to collect all information regarding the price update—as far as possible—from the Feed it is built to service. As mentioned above, the Olsen Data Server is designed to handle multiple Feed/Platform interfaces, and each interface needs to be supported by its own collector process to handle the unique logic (of internal relations between symbols) of the interface in question.
Filter
Human input errors as well as automated quoting algorithms run by market makers inevitably produce bad data—especially for non-binding quotes for OTC instruments. Exchange-traded instruments suffer somewhat less from these problems, but tick data (for transactions or quotes) from exchanges also show signs of contamination.
Traders looking at real-time data graphs on-screen intuitively filter out bad data. Therefore, using filter algorithms may seem trivial; but experience shows how quickly market changes can cause a filter to appear excessively conservative or brash. The development of good filter algorithms borders on work in the area of artificial intelligence; the ability to adapt to rapidly evolving market conditions is paramount.
Any analysis of high-frequency data, as well as risk-management exercises (such as VaR calculations), are strongly influenced by bad data. Olsen learned this 20 years ago when it began to publish the first papers ever that investigated the behavior of high-frequency market evolution.
The filter component is embedded within the collector process. The Repository writes every tick appearing from the live data interface, but it assigns to every tick a credibility number between 0 and 1. A credibility of 0.5 or above may be regarded as a default threshold (a higher credibility means the tick is good). However, the data retrieval system—RIDE — can extract data with a custom credibility level, to allow the user to determine the stringency of the filter process. So, while the credibility number is assigned when the data is written, filtering occurs only when the data is retrieved for use in an application.
The embedded filter also maintains a checkpoint of the filter state for each of the thousands of instruments being collected. In case the system must be restarted, this enables the recovery of the latest filter state.
Technical Paper
See published Technical paper on the Olsen Data Filter.
Interface Bridge
This is a Real-Time Application that would be able to take data from Platform A and feed it to Platform B for consumption by applications which interface only with Platform B.Olsen Financial Technologie consulting services can build such bridges to facilitate integration and maintain services during times of transition or to preserve old applications. It is not always possible to recover all the fields associated with Platform B using data from Platform A for all instruments. In general, we have to analyze the complexity of the information in order to provide bridges that would work for specific symbols or sets of instruments so that existing applications could be supported. The purpose of this component is not a complete and exact translation of one feed into another.
Real Time Data Apps
Real-time applications interfacing with the Olsen server can take advantage of data from multiple live data feeds, making the applications exceedingly fail-safe and robust.
A common usage of this component is as a platform for building real-time forecasting and trading models. Another common application is to generate real-time computed market indicators (such as continuously updated volatilities and/or correlations from forex spot or zeroes from bond prices).
Data generated by this component (forecast or indicators) can also be fed back to the Repo Server and stored in the Repository, as indicated on the diagram.
Real-Time + Historical Data Apps
These are real-time applications that also require historical data. Although conceptually simple, we consider these apps a distinct category because the dual purpose they serve invokes unique as well as classic problems. Many of these problems, which we have solved, have to do with the point of transition between historical and real-time data, and how best to handle the rare conditions that arise under such circumstances.
The Repo API allows Real-Time + Historical Apps to be elegantly coded, allowing outwardly seamless access to the data.
Repo API
The Repo API allows applications to be written to interact with the Olsen server so as to access real-time as well as historical data. A unique feature of this component is a seamless call structure, which hides the distinction between historical and real-time data. This allows the build-up of financial indicators in real-time applications without having to write code that shifts the connection from the Repository (for historical data) to the Repo Server (for real-time data).Repo Server
The layer that guards the Repository . It controls the writing of the database and allows multiple processes to register for this purpose. It makes sure that ticks are written in time order and prevents any ill-formatted information from passing to the database.
The Repo Server also re-transmits real-time data to consumer applications who subscribe for this data via the Repo API .
Finally, the Repo Server facilitates maintenance of the database via specialized functions. Relatively complex transactions, such as replacing sections of data without switching off the collection process, are achievable through run-time commands issued to the Repo Server.
Repository
We distinguish between the Repository and the Database:Repository = the software architecture
Database = the contentThe Repository has evolved from our long experience with the need to store and maintain large sets of high-frequency financial data. It is associated with several maintenance tools that allow our experts to maintain it remotely.
Technical Paper
Database
We distinguish between the Database and the Repository:Repository = the software architecture
Database = the contentOur database contains tick-by-tick data collected since 1986. The Olsen Server, deployed at a customer site, can be initialized with a Repository containing an appropriate subset of the database to support mission-critical applications that require access to historical data. The subset can be constructed with respect to time as well as to instrument type.
The following figures reflect the scope of the database
| FX quotes | 330. 5 mil |
| Equity index levels | 212.2 mil |
| FX quotes | 330. 5 mil |
| Interest rate deposit quotes | 16.3 mil |
| Interest rate swap quotes | 52.6 mil |
| Benchmark bond quotes | 45.1 mil |
Data Distributor
This receives real-time data from the Repo Server and re-transmits it to one or more Real-Time Data Applications. The data distributor consolidates/optimizes requests from multiple applications requiring real-time data in order to reduce bandwidth. The distributor and Real-Time Data Applications are associated via the Repo API software layer.Blender
The blender is an automated method of consolidating multiple feeds and creating a single source of fine data. Unlike the filter, which looks only at past data from the same source, the blender looks at multiple data sources (including computed data generated by other real-time data modules) to generate high-frequency data of the highest quality. In many respects, the blender behaves like an artificial market maker. The blender works on the principle of weighting each of the latest datum. Weights are credited based on the source of the data and then reduced, based on the age and spread (and, possibly, inverse filter credibility) of the datum. The algorithm can be understood by imaging a two-column table:- Data publication is triggered when the first tick arrives from any source after a configured sleep time following the last publication.
- When publication is triggered, the latest middle prices from each feed are collected and placed in sorted order in the first column of our hypothetical table.
- For each of the middle prices, the corresponding net weight (after appropriate reduction) is entered in the second column.
- A target weight is calculated as one-half of the sum of the weights in the second column.
- The second column is accumulated by addition, starting from the top row, until the (select) row where the target weight is equaled or exceeded.
- The datum associated with the select row is published.
Technical Paper on the Blender
See a published technical paper on the Blender application for forex spot data
The ideas presented in this paper can easily be applied to other instrument sets using the same techniques. Forex spot data, however, has the advantage that even from a single data feed one can construct multiple virtual feeds of computed forex cross rates through vehicle currencies. (Of course, for the purpose of the blender, different institutional contributors can also be regarded as distinct feeds.)